Descriptive analytics
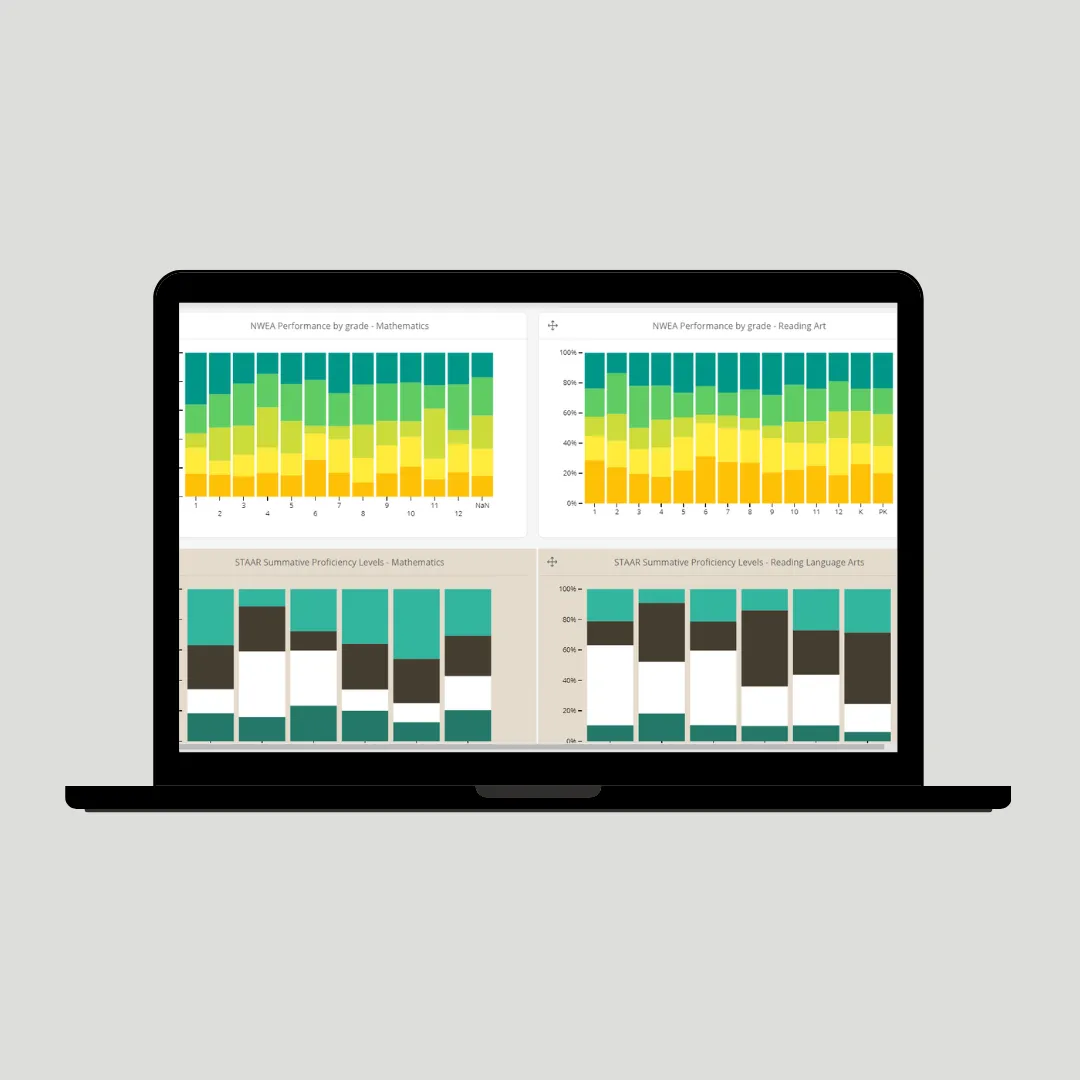
Analysis of historical data that explains past performance — clear reports on what happened, why, and the trends and patterns behind it.
Services
Transform the data you collect into actionable insights — identify trends, optimize processes, improve efficiency and gain a competitive edge.
What we do
Analysis of historical data that explains past performance — clear reports on what happened, why, and the trends and patterns behind it.
Machine learning and statistical models that forecast trends and behavior, so you can anticipate market changes, manage risk and act proactively.
Beyond forecasting: specific, data-backed recommendations on the best course of action to reach your business goals.
Manage and analyze large, complex structured and unstructured datasets from many sources to uncover deep insights in real time.
Custom BI dashboards and reports to monitor KPIs and track progress, integrated seamlessly with your existing tools.
Charts, graphs and dashboards that make complex data easy to interpret and reveal hidden trends and opportunities.
Identify patterns, correlations and anomalies in large datasets to discover hidden insights and opportunities.
FAQ
It helps you make data-driven decisions, optimize operations, improve customer experiences and boost overall performance. It can identify areas for growth, reduce costs and reveal market trends and customer behavior.
Descriptive analytics (understanding past trends), predictive analytics (forecasting future outcomes) and prescriptive analytics (recommending actions to reach desired results). We also specialize in big data analytics, business intelligence and data visualization.
We implement strict protocols and encryption to safeguard your sensitive information, and comply with global data protection regulations such as GDPR so your data is handled securely and ethically.
Retail, healthcare, finance, manufacturing, real estate, e-commerce and more. Any business that generates data can use analytics to improve decisions, streamline operations and gain a competitive advantage.
It depends on complexity, data volume and specific requirements. Small projects may take a few weeks, while larger, more complex projects can take several months. We provide an estimated timeline after assessing your needs.
Industry-standard tools like Python, R, SQL, Tableau, Power BI, Apache Hadoop and Spark, depending on your project. Our team works with both structured and unstructured data.
Yes. We integrate analytics with your existing cloud platforms, ERP systems or CRM tools for seamless, real-time insights.
Predictive analytics uses historical data, machine learning and statistical models to forecast future trends or outcomes. It helps you anticipate customer needs, manage risks and optimize resource allocation.
Absolutely. We create interactive, insightful visualizations with tools like Tableau and Power BI, as well as custom dashboards, so you can understand complex data at a glance.
Explore
Tell us about your data and goals and we’ll outline the right analytics approach.

We help organizations thrive in the digital age — building custom software, web and mobile applications, and AI-powered tools on our Nodio platform.
hr@vizipp.com Proud member of TIPS-USA